Use of Vibrational Optical Coherence Tomography to Noninvasively Differentiate Between Benign Fibrotic Tissue and Fibrosis Associated with Melanoma
Authors: Frederick H. Silver1,2*, Tanmay Deshmukh2, Michael Gonzalez-Mercedes2
1Department of Pathology and Laboratory Medicine, Robert Wood Johnson Medical School, Rutgers, the State University of New Jersey, Piscataway, NJ 08854, USA
2OptoVibronex, LLC., Ben Franklin Tech Partners, Bethlehem, PA 18015, USA
*Correspondence to: Frederick H. Silver, Department of Pathology and Laboratory Medicine, Robert Wood Johnson Medical School, Rutgers, the State University of New Jersey, Piscataway, NJ 08854, USA; E-mail: silverfr@rutgers.edu
Received: 29 November 2022; Revised: 21 December; Accepted: 28 December 2022; Published: 02 January 2023
Copyright: © 2023 Silver FH. This is an open-access article distributed under the terms of the Creative Commons Attribution License, which permits unrestricted use, distribution, and reproduction in any medium, provided the original author and source are credited.
Citation: Silver FH (2023) Use of Vibrational Optical Coherence Tomography to Noninvasively Differentiate Between Benign Fibrotic Tissue and Fibrosis Associated with Melanoma, 21st Century Pathology, Volume 3 (1): 139
Abstract
In this study we report the use of vibrational optical coherence tomography to compare fibrosis in a skin lesion to that observed in a melanoma. Using vibrational optical coherence tomography (VOCT) it is possible to noninvasively differentiate between fibrosis found in benign skin lesions and fibrosis associated with skin cancer. Cancerous skin lesions exhibit new resonant frequencies at 80Hz and 130Hz along a fibrotic resonant frequency at about 260 Hz. The 80 Hz and 130 Hz peaks are absent in benign lesions. VOCT can provide another noninvasive tool along with dermoscopy and visual inspection to provide diagnostic information about the nature of skin lesions. VOCT can be operated remotely and can be used with telemedicine to provide diagnosis of difficult skin lesions in remote areas where the availability of a dermatologist is limited.
Keywords:
Collagen; Fibrosis; Melanoma; Resonant frequency; OCT; Vibrational OCT; Blood vessels; Mechano-vibrational spectrum
Introduction
Approximately 45% of all deaths in the US are associated with fibrotic disease [1]. But not all fibrosis is associated with tissue pathology; collagen remodeling and stiffening is a possible end-product of wound healing. Therefore, it is important to be able to differentiate between pathological fibrosis associated with carcinomas and excessive deposition of collagenous tissue after trauma or surgery. Since the number of skin cancers are projected to increase dramatically by the year 2050, new diagnostic techniques are needed to assist the Dermatologist in analyzing atypical lesions.
Disturbances in the regulation of synthesis and deposition of collagen can result in severe pathological conditions in Scleroderma, cutaneous Graft-versus-Host-Disease, excessive scarring after trauma or carcinogenesis [2]. In the skin, periostin is highly expressed in fibrotic scars and is upregulated during cutaneous wound repair, where it is believed to facilitate myofibroblast differentiation [3]. Fibroblast behavior has been shown to depend on origin, and anatomical location within the skin [4]. Fibroblast heterogeneity has been established and its influences on wound healing and fibrosis [4]. In systemic sclerosis collagen types I and III and fibronectin are exhibited at higher levels compared to normal skin [5].
Fibrosis associated with skin cancer involves an epithelial?mesenchymal transition (EMT) that results in a change of the cell phenotype of epidermal cells [6]. During EMT, cell-cell connections loosen, cells become motile, and become resistant to apoptosis [6]. Transforming growth factor beta 1 (TGF-?1), tumor necrosis factor alpha (TNF- ?) and hypoxia cooperate in the triggering of EMT both in cancer and fibrosis [6, 7] converging in the induction of Snail [7]. It is therefore important to be able to differentiate between fibrosis associated with carcinomas and that which is associated with other disorders.
We have developed a noninvasive diagnostic test termed vibrational optical coherence tomography (VOCT) based on the reflection of infrared light and acoustic sound to create a ?virtual biopsy? and a quantitative mechano-vibrational spectrum of skin [8-11]. This data can be able used to differentiate between fibrosis associated with normal scar tissue and fibrosis that surrounds basal cell carcinomas, squamous cell carcinomas and melanomas [8-11]. The results of pilot studies suggest that although fibrosis is associated with normal wound healing and carcinomas, the addition of new cells (80 Hz) and new blood vessels (130 Hz) that are not found in normal skin wounds can be used to differentiate between fibrosis associated with benign and cancerous skin lesions [8-11]. The purpose of this paper is to present a comparison between fibrosis associated with a benign skin lesion and melanoma.
Methods
Normal skin (N=14), fibrous tissue deposited on the back of a subject?s finger, and a melanoma (N=57) were studied using VOCT after informed consent was obtained, as reported previously [8-11]. OCT images of the samples were obtained in the scanning mode and were color-coded as discussed previously [8-11]. Measurement of the resonant frequencies of the major components of skin were made using an OQ Labscope 2.0 (Lumedica, Inc., Durham, NC) that was modified by adding a 2 inch-diameter speaker placed about 2.5 inches from the area to be studied. Both infrared light and a sinusoidal sound wave between the frequencies of 30 and 300 Hz were applied to the skin at intervals of 10 Hz along the axis of the light beam as described previously [8-11]. A plot of weighted displacement versus frequency was obtained for each specimen after correcting for vibrations due to the speaker. All weighted displacement data collected were normalized to the largest peak in the weighted displacement versus frequency spectrum. The peak frequency (the resonant frequency), fn, is defined as the frequency at which the displacement of each major skin component is maximized. Resonant frequencies for normal cells in skin (50 Hz), dermal collagen (100 Hz), and dermal blood vessels (150 Hz) have been defined from results of previous studies as well as new lesion associated cells (80 Hz), new friable blood vessels (130 Hz) and new fibrous tissue (260 Hz) [8-11].
Results and Discussion
In this study we compared OCT images and weighted displacement versus frequency data for normal skin, an area of skin with suspected fibrosis, and a melanoma. An OCT image of normal skin (Figure 1A) was characterized as containing a yellow stratum corneum, pink layer of cells including the basal cell layer and layers of differentiating basal cells between the basal cell layer and the stratum corneum. The papillary dermis is seen as the blue layer beneath the basal cell layer [Figure 1A]. A typical plot of weighted displacement versus frequency is shown for normal skin in Figure 1B. Figure 1C shows a typical scan of pixel intensity versus depth for the cross-section shown in Figure 1 A illustrating a slow decrease in the pixel intensity as the depth increases within the skin increases. Major resonant frequencies are seen at 50-60 Hz (normal epithelial cells and fibroblasts), 100 Hz (dermal collagen), 150 Hz (normal blood vessels) as discussed previously [8-11]. In comparison a typical color-coded melanoma is shown in Figure 2A containing a very thin stratum corneum, and a thin papillary dermis with black areas where the cancerous lesions are found. A plot of weighted displacement versus frequency (Figure 2B) shows new resonant frequency peaks at 80 Hz (new cancer associated cells), at 130 Hz (new friable blood vessels), and at 250-260 Hz (new fibrous tissue) as reported previously [8-11]. Statistical analysis comparing the peak heights at 50, 80, 130 and 250 Hz of normal skin and melanoma indicate that they are statistically different at a p value less than 0.0004 (Table 1).
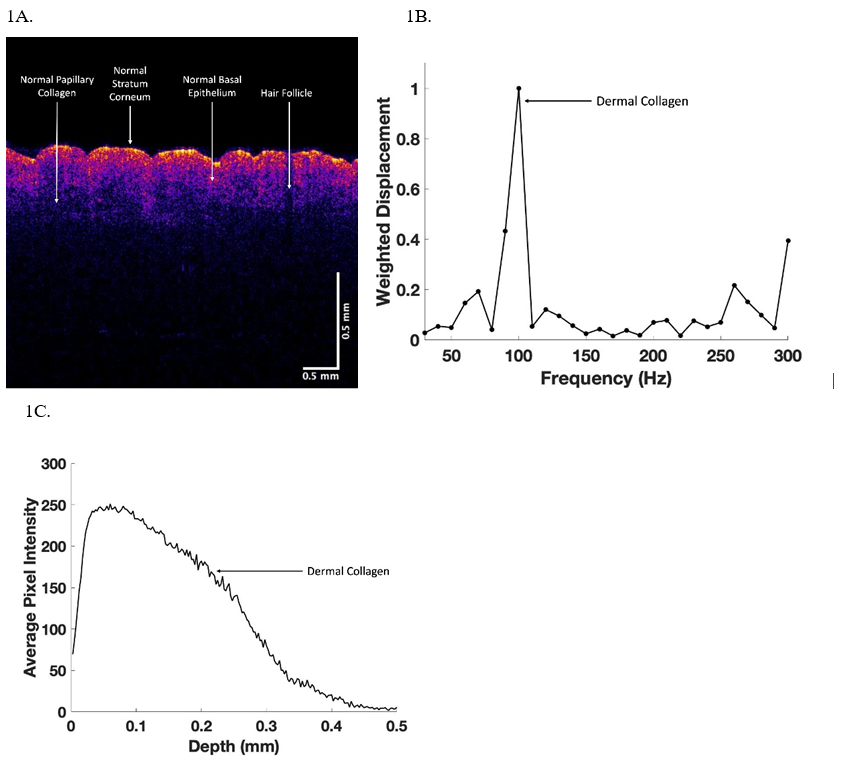
Figure 1: OCT color-coded image (1A), weighted displacement versus depth (2B) and scan of pixel intensity versus depth (3C) for normal skin from the arm. Note the weighted displacement versus frequency measurements are made at 10 Hz intervals so that the resonant frequencies of cells occur at about 60 Hz, dermal collagen at about 100 Hz and fibrous tissue at about 260Hz.
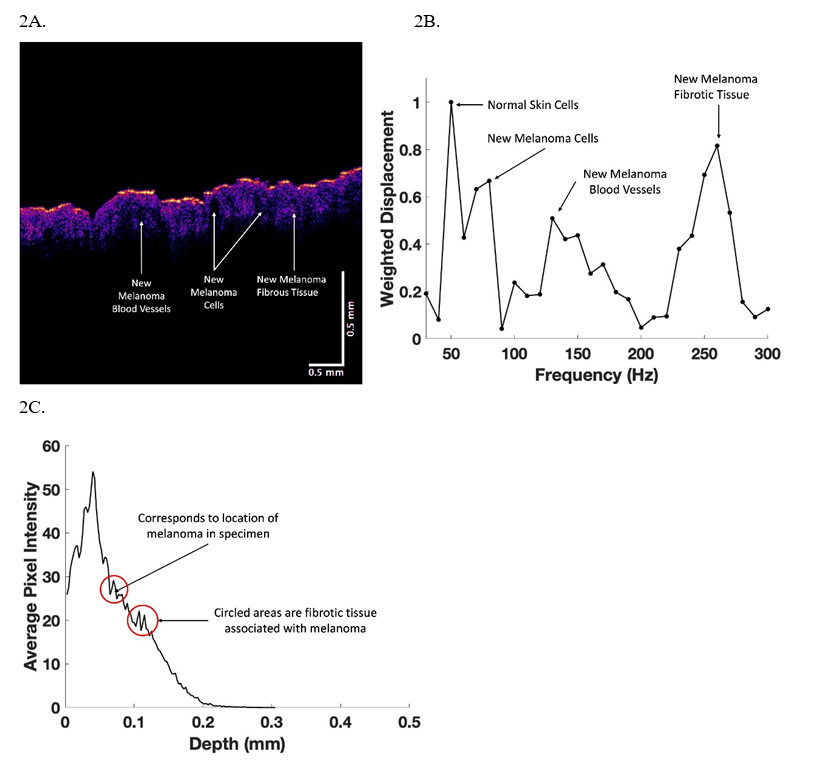
Figure 2: OCT color-coded image (2A), weighted displacement versus depth (2B), and scan of pixel intensity versus depth (2C) for a melanoma. Note the weighted displacement versus frequent measurements (2B) are made at 10 Hz intervals so that the resonant frequencies of cells occur at about 60 Hz, new dermal cells at 80 Hz, dermal collagen at about 100 Hz, new blood vessels at 130 Hz and fibrous tissue at about 260Hz. The location of the melanoma lesions are circled in C that correspond to the areas of cancer lesions seen in A.
Table 1: Statistical comparison between normal skin and melanoma using an unpaired one tailed student?s t-test. Note the 50, 80, 130, and 250 Hz peaks have p values less than 0.0004 demonstrating that the mechano-vibrational peak heights of normal skin and melanoma are statistically different. N=14 for normal skin and N=57 for melanoma.
| Normal Skin: Melanoma | |
|---|---|
| 50 Hz | 0.00004 |
| 80 Hz | 2.9 × 10⁻⁷ |
| 130 Hz | 6.2 × 10⁻⁹ |
| 250 Hz | 0.00002 |
In comparison, an area of raised skin on the back of one of the fingers of a subject had a color-coded OCT image of their skin that was unusual (Figure 3A). The OCT image showed a smooth epidermis, normal looking epidermal cell and upper papillary layers, an opaque layer and a normal collagenous layer in blue. The large peak at 150 Hz suggests the presence of blood vessels. A plot of weighted displacement versus frequency (Figure 3B) showed small peaks at 80 and 130 Hz and a large peak at 250-260 Hz. Finally, Figure 4A shows a color-coded OCT image of the skin on top of the hand of the subject whose skin is shown in Figure 3. Note the normal resonant frequency peak of dermal collagen and only a small fibrotic peak at 250 Hz (Figure 4B). The plot of pixel intensity versus depth shown in Figure 4C is smooth unlike that shown in Figure 3C.
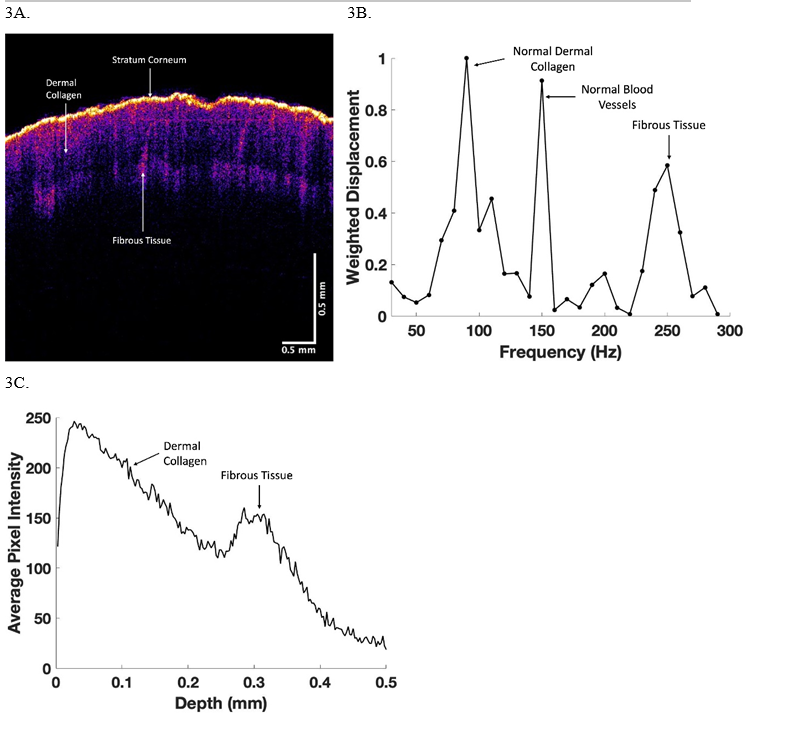
Figure 3: OCT color-coded image (3A), weighted displacement versus depth (3B), and scan of pixel intensity versus depth (3C) for skin on the back of the finger of a subject with superficial skin thickening. Note the weighted displacement versus frequent measurements (3B) are made at 10 Hz intervals. The cellular peak is very small in comparison to the dermal collagen peak at about 100 Hz, blood vessel peak at 150 Hz, and the fibrotic peak at about 260Hz. The large black area in the A appears to be the location of the blood vessels. The fibrotic peak is in the lower part of the image in A based on the scan of pixel intensity versus depth shown in 3C.
Figure 4: OCT color-coded image (4A), weighted displacement versus depth (4B), and scan of pixel intensity versus depth (4C) for skin on the front of the hand of the subject shown in Figure 3. Note the weighted displacement versus frequent measurements (4B) are made at 10 Hz intervals. The major resonant frequency peak is dermal collagen at 100 Hz. Note the absence of a significant fibrotic peak in B and no bump in C as seen in 3C.
Conclusion
Using VOCT it is possible to noninvasively differentiate between fibrosis found in normal skin, benign skin lesions, and fibrosis associated with skin cancer. In this manner VOCT along with visual inspection and dermoscopy can provide the physician with a rapid method to noninvasively image and collect physical information that can provide diagnostic information about the nature of skin lesions. VOCT can be performed along with use of visual and dermoscopic, through telemedicine to provide the physician with methods to diagnose difficult skin lesions in remote areas where the availability of Dermatologists is limited.
Funding
None
Personal Financial Interests
FHS is a stockholder in OptoVibronex and TD and MGM are employees of the company.
Institutional Review Board Statement
All human studies were reviewed and approved by WCG IRB, approval code 1-1410030-1, 5 April 2021.
Author Contributions
Study planning (FHS and MGM), Data collection (MGM and TD), Data analysis (TD and MGM), Manuscript writing (FHS), Manuscript review and editing (FHS, MGM, TD).
References
1. Wynn TA. Fibrotic disease and the TH1/TH2 paradigm. Nature Reviews Immunology. 2004 Aug;4(8):583-94. https://doi.org/10.1038/nri1412
2. Do NN, Eming SA. Skin fibrosis: Models and mechanisms. Current Research in Translational Medicine. 2016 Oct 1;64(4):185-93. https://doi.org/10.1016/j.retram.2016.06.0032452-3186
3. Nikoloudaki G, Creber K, Hamilton DW. Wound healing and fibrosis: a contrasting role for periostin in skin and the oral mucosa. American Journal of Physiology-Cell Physiology. 2020 Jun 1;318(6):C1065-77. https://doi.org/10.1152/ajpcell.00035.2020
4. Griffin MF, desJardins-Park HE, Mascharak S, Borrelli MR, Longaker MT. Understanding the impact of fibroblast heterogeneity on skin fibrosis. Disease Models & Mechanisms. 2020 Jun 1;13(6):dmm044164. https://doi.org/10.1242/dmm.044164
5. Busquets J, Del Galdo F, Kissin EY, Jimenez SA. Assessment of tissue fibrosis in skin biopsies from patients with systemic sclerosis employing confocal laser scanning microscopy: an objective outcome measure for clinical trials?. Rheumatology. 2010 Jun 1;49(6):1069-75. https://doi.org/10.1093/rheumatology/keq024
6. Runyan RB, Savagner P. Epithelial-mesenchymal transition and plasticity in the developmental basis of cancer and fibrosis. Dev Dyn. 2018 Mar 1;247(3):330-1. https://doi.org/10.1002/DVDY.24620
7. López?Novoa JM, Nieto MA. Inflammation and EMT: an alliance towards organ fibrosis and cancer progression. EMBO molecular medicine. 2009 Sep;1(6?7):303-14. https://doi.org/10.1002/emmm.200900043
8. Silver FH, Deshmukh T, Benedetto D, Kelkar N. Mechano?vibrational spectroscopy of skin: Are changes in collagen and vascular tissue components early signs of basal cell carcinoma formation?. Skin Research and Technology. 2021 Mar;27(2):227-33. https://doi.org/10.1111/srt.12921
9. Silver FH, Kelkar N, Deshmukh T, Horvath I, Shah RG. Mechano-Vibrational Spectroscopy of Tissues and Materials Using Vibrational Optical Coherence Tomography: A New Non-Invasive and Non-Destructive Technique. Recent Progress in Materials. 2020 Apr;2(2):1. https://doi.org/10.21926/rpm.2002010
10. Silver FH, Deshmukh T, Kelkar N, Ritter K, Ryan N, Nadiminti H. The “Virtual Biopsy” of Cancerous Lesions in 3D: Non-Invasive Differentiation between Melanoma and Other Lesions Using Vibrational Optical Coherence Tomography. Dermatopathology. 2021 Dec 13;8(4):539-51. https://doi.org/10.3390/dermatopathology8040058
11. Silver FH, Deshmukh T, Ryan N, Romm A, Nadiminti H. “Fingerprinting” Benign and Cancerous Skin Lesions Using Vibrational Optical Coherence Tomography: Differentiation among Cancerous Lesion Types Based on the Presence of New Cells, Blood Vessels, and Fibrosis. Biomolecules. 2022 Sep 21;12(10):1332. https://doi.org/10.3390/biom12101332